
Back in 2012 we did a side-by-side comparison of the four largest technology companies and their quarterly growth and other financial metrics. A year later in 2013 the four companies were again compared using Wolfram Alpha to generate lots of charts and tables by simply typing in “Google vs. Amazon vs. Apple vs. Microsoft” in the search bar.
Today, six years later, this same exercise reveals very strong growth. The big companies are getting (much) bigger. Here are some comparisons:

With the underlying numbers:
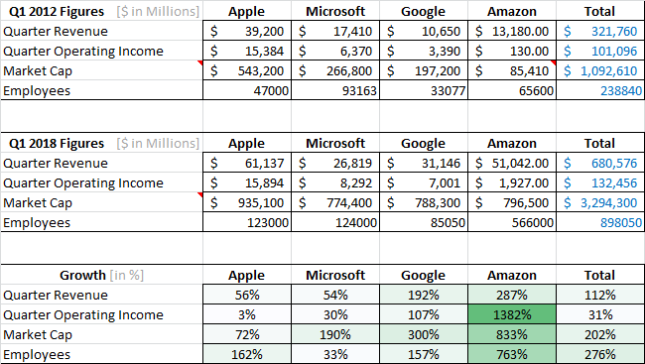
(Market cap as of market close on 2/3/2012 and 6/1/2018; sources the respective 10-Q filings; scales are the same for left and right charts. Google refers to its parent Alphabet, Inc.)
When taken together, over the last six years the four companies have grown as follows:
- Revenue more than doubled (+112%, 13.3% annualized)
- Income grew only moderately (+31%, 4.6% annualized)
- Market cap tripled (+202%, 20.2% annualized)
- Employees almost quadrupled (+276%, 24.7% annualized)
Of course, the $ numbers need to be inflation-adjusted, but US inflation rates were around 2% or less between 2012-2018, which amounts to about 10% over that period of time. Hence inflation is not qualitatively influencing this analysis or comparison.
Amazon grew the most, with its market cap growing more than 9 fold (+833%) and its employees more than 8-fold (+763%) to more than half a million people. Back in 2012, all four combined just exceeded $1 trillion in market cap; this has swollen to $3.3 trillion.
These are the biggest nominal market cap values in history. When comparing them to the GDP of countries, they would each rank in the Top-20. According to 2018 GDP projections by the International Monetary Fund, Apple would rank 18 behind the Netherlands (17th, $945,327 million), the other three companies would rank 19 behind Turkey (18th, $909,855 million). The market cap of these four companies combined would rank 5th behind Germany (4th, $4,211,635 million). In other words, only the top four countries by GDP (United States, China, Japan and Germany) are bigger than the market cap of Apple, Microsoft, Google and Amazon combined.
These corporations are transnational entities with a global customer base. Arguably, their size and economic power has grown so rapidly that the legal, tax and trade frameworks governing their operations can’t always keep up. Similarly, when companies get so large and rich, they can buy startups and entice talent to join them at a rate newer entrants or even governments cannot match. Apple’s cash position at the end of Q3’2017 was roughly $270 billion (source Asymco). It is not obvious that consumers always benefit from companies growing that large (see monopoly and anti-trust laws). Thankfully, the current technology oligopoly leads to healthy competition.
As before, there remain significant differences in the revenue segmentation across these four companies:

Arguably, Microsoft has the broadest diversification and hence the most stability against disruptive innovation. Its three segments are not only roughly equal in size, but in turn contain a variety of different sub-segments. Productivity and Business Processes includes Office, Exchange, Skype, LinkedIn, Dynamics; Intelligent cloud includes Windows Server, SQL Server, Azure and Consulting Services; Personal Computing includes Windows, Devices, XBox and Search/Advertising. Microsoft’s Azure cloud services have closed the gap to Amazon’s AWS business and recently overtaken it by quarterly revenue.
If consumers were to search somewhere else than using Google, shop somewhere else than Amazon or buy no more iPhones, these companies would all shrink by an order of magnitude. Microsoft stands well positioned by comparison.
The following radar plot shows the above table numbers in a different perspective:

For each metric, 100% corresponds to the maximum of the four companies. Amazon has the most employees, Apple is the largest in quarterly revenue, profit and market cap. Some comments on the 2012 – 2018 changes:
- Employees: Microsoft only added +35% of employees; Apple and Google more than doubled at about +160%; Amazon exploded by adding +763% to an almost 9-fold increase from 65,600 to 566,000.
While Microsoft had more than twice as many employees as Apple in 2012, they are the same size now (~123,000). - Profits: While the green line (market cap) in the radar plot almost looks like an even-sized rectangle, the red line (profit) is much tilted towards Apple and leaves comparatively little for Amazon.
- Revenue per employee: Apple still takes the price in this rank (~$2million/year), with Google ($1.47million/year) and Microsoft ($0.87million/year). Amazon “only” earns $0.36million/year. In that metric, Amazon slipped from rank 2 to the bottom and Apple’s lead is not as strong as it was in 2012.
Much has been speculated about the future of the biggest technology companies and the nature of the next disruptions such as cloud, augmented reality (AR) and artificial intelligence (AI). Perhaps the biggest disruptor for this elite club of technology companies is Facebook, which only went public six years ago. FB currently has a $562 billion market cap. It is now bigger than these four were back in 2012, and about 70% of the size they are now. My own skepticism at the time of the Facebook IPO was proven wrong by its continued and strong growth. Their base of about 2 billion free accounts is by far the largest of any company ever. That said, I personally still have no Facebook account, while I’m using the products and services of each of the top four companies nearly every day! It will be interesting to see which one first breaks the $1 trillion market cap threshold.
Addendum 11/19/2018:
A lot has happened over the last 6 months. First, the above mentioned run-up continued and produced AAPL in early Aug-2018 as the first company to be publicly traded company worth $1 trillion. AMZN followed suit soon thereafter in early Sep-2018, but only stayed at that lofty valuation for a day or so. Here is a snapshot of the valuations as of Aug-31, 2018:

Later in the fall the tides turned, and four of the above five stocks are now in correction territory. Here is the above snapshot for today, Nov-19, 2018:

Here are the changes for all five companies summarized:

Microsoft appears to have weathered the recent turbulence much better than the other companies. MSFT is down only 6.8% over the last 10 weeks; AAPL and GOOG each lost 16-20%, which at these valuations amounts to $217B and $140B, respectively! And AMZN and FB each lost about 25% of their market cap.
The combined total market value loss of the five companies is near $788B or $157 each on average. It is amazing to see how volatile the tech market has become in recent months. [Note on 11/21: Coincidentally, the New York Times ran a headline story the next day 11/20 titled The Tech Stock Fall Lost These 5 Companies $800 Billion in Market Value; the only difference was they excluded Microsoft and included Netflix.]
The earlier post pointed out that Microsoft was very well positioned, strongly diversified in its business, under fresh leadership of its CEO Satya Nadella since 2015, investing in new technologies (cloud, AI, AR) and much more conservative personnel expansion during the good times. They are now number #2 and maybe on track to pass AAPL again on their way to becoming the most valuable company in the world.
