
We have posted about Sankey Diagrams some 11 years ago on this Blog. It is a remarkably useful visualization for the flow of continuous quantities like money, electricity, raw materials through systems. There have been other blogs dedicated entirely to Sankey diagrams, such as https://www.sankey-diagrams.com where the author wrote 660 posts during 2007 – 2021.
Yet, sadly, this type of diagram has still not made it into Excel or other mainstream chart libraries.
One interesting use of it has been popularized by AppEconomyInsight for Income Statements to visualize how companies make money. Here is a recent example for Meta (FaceBook):

It shows the size and diversity (or lack thereof) of a business revenue and profitability. It is so much more intuitive than the pages of numbers in the public income statements! One of the best examples of Visualign’s motto: Visualize Data. Generate Insight!
The website now has many dozens of charts depicting large publicly traded companies and the information from their quarterly income statements. The Sankey diagram has even become the website logo

We have also looked at four large tech companies, starting with this post back in 2012 on Side by Side: Apple, Microsoft, Google, Amazon. We had created a composite back then for these four companies to show just the sources of revenue (akin to the left side of the Sankey diagrams for the inflow to the central revenue bar):
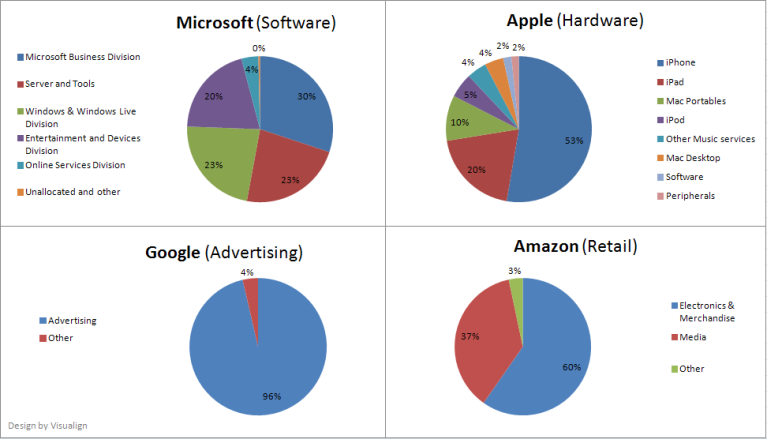
Here is a similar composite of the Sankey diagrams from AppEconomyInsight for those four companies:

(Source: appeconomyinsight.com; Note: All recent but different quarters as some are not available or behind paywall.)
Such a side-by-side comparison reveals many interesting insights:
- All companies have massive revenues in the order of $50-100B per quarter, with biggest by Amazon.
- Software company Microsoft has the largest operating margin (40%) and net profit margin (36%).
- Retail company Amazon has by far the smallest net profit margin (5%).
- Its AWS division accounts for 16% of revenue, but 70% of operating profit!
- Advertising companies Meta and Google are trying to diversify sources of revenue.
- Google has been able to diversify via its Google Play and Cloud segments contributing nearly 22% of revenue and showing much stronger growth.
- Meta’s Reality Labs (RL) revenues are paltry (1% of overall revenue), and the RL losses reduced the other operating profits by more than a quarter (28%).
- Hardware company Apple is still dependent on its dominant iPhone for nearly half of all revenue (49%), but its fast growing Services segment already generates more than a quarter (26%) of that.
From a profitability perspective, these diagrams also nicely show what business schools will tell you:
- Making money from retail is hard.
- Making money from software and services is easier.
- Making money from hardware can be very profitable – if there is killer demand. One great example of that is the Apple iPhone demand over the last 15 years. Another great recent example is the demand for Nvidia GPU chips for data centers due to the generative AI breakthroughs of ChatGPT and similar models. See the recent breakdown of Nvidia with a staggering 46% net profit margin:
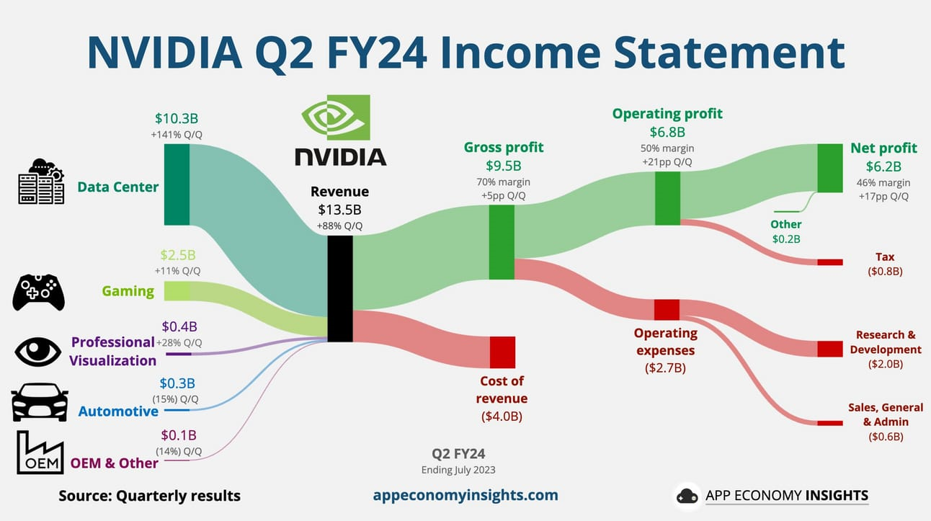
The above comes from an article aptly called the “Nvidia: The iPhone moment of AI”. Coincidentally, in the last article on the four biggest tech companies back in 2018, I speculated which would be the next tech company to reach the trillion dollar valuation. It was not Meta, but first Tesla and then Nvidia.
Tesla’s income statement Sankey diagram is also interesting to see:

It would be great to have a generalized template to convert traditional income statements into such charts. Even better would be an interactive version of the Sankey diagram where you could:
- Highlight or Filter one of the revenue branches to see its profitability
- Highlight or Filter one of the expense or profit branches to see its contributors
Of course such interactivity would require a more detailed underlying model of accounting flows, which may or may not be disclosed by the company.
