Over the last two years we have posted some visualization and interpretation of Gartner’s Magic Quadrant Analysis on BI companies. The previous articles in 2012 and 2013.
A Blog reader contacted me about the 2014 update; he sent me the {x,y} coordinate data for 2014 and so it was relatively straightforward to update the public Tableau workbook for it. Here is the image of all 29 companies with their changes from 2013 to 2014:

Gartner’s Magic Quadrant for Business intelligence, changes from 2013 to 2014
With the slider controls for Execution and Vision as well as the changes thereof, it is easy to filter the dashboard interactively. For example, there were a dozen companies who improved in their execution score (moving up in the quadrant):

Subset of companies who improved execution over the last year.
Most of the companies improving their execution are niche players, with SAP being the only leader improving its execution score.
Most of the leaders improved in their vision score (moving right in the quadrant), including Tableau, QlikTech, Tibco and SAS.

Subset of companies who improved vision over the last year.
7 companies, most of them leaders, lost ground on both execution and vision (moving to the bottom-left):
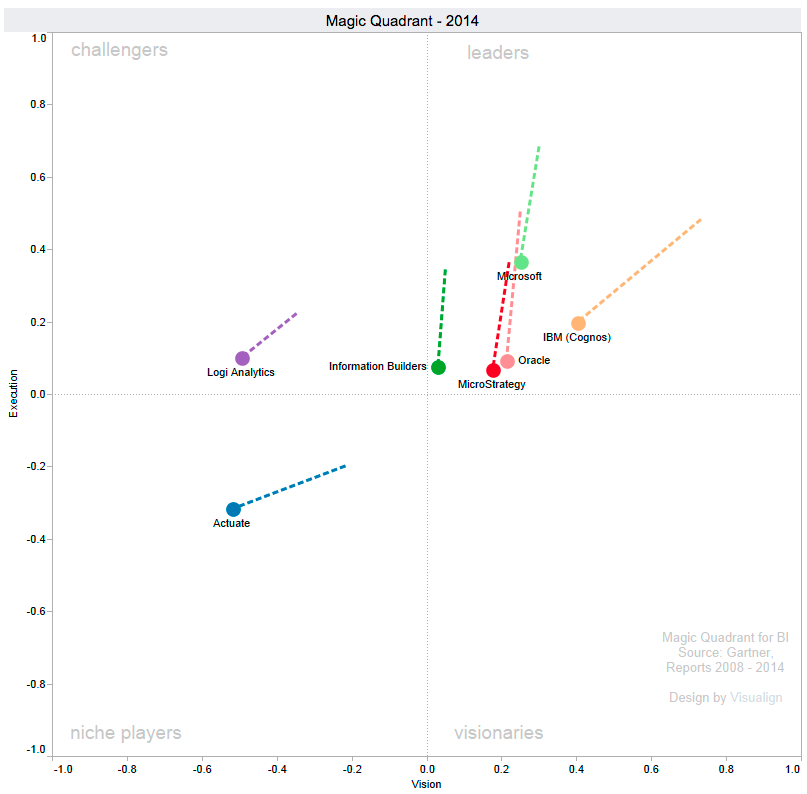
Companies who lost ground on both execution and vision in 2014
Lastly, I have updated the Public Tableau workbook with the Magic Quadrant as originally published in 2012 with the data for 2013 and 2014. (Click here for the interactive drawing.)
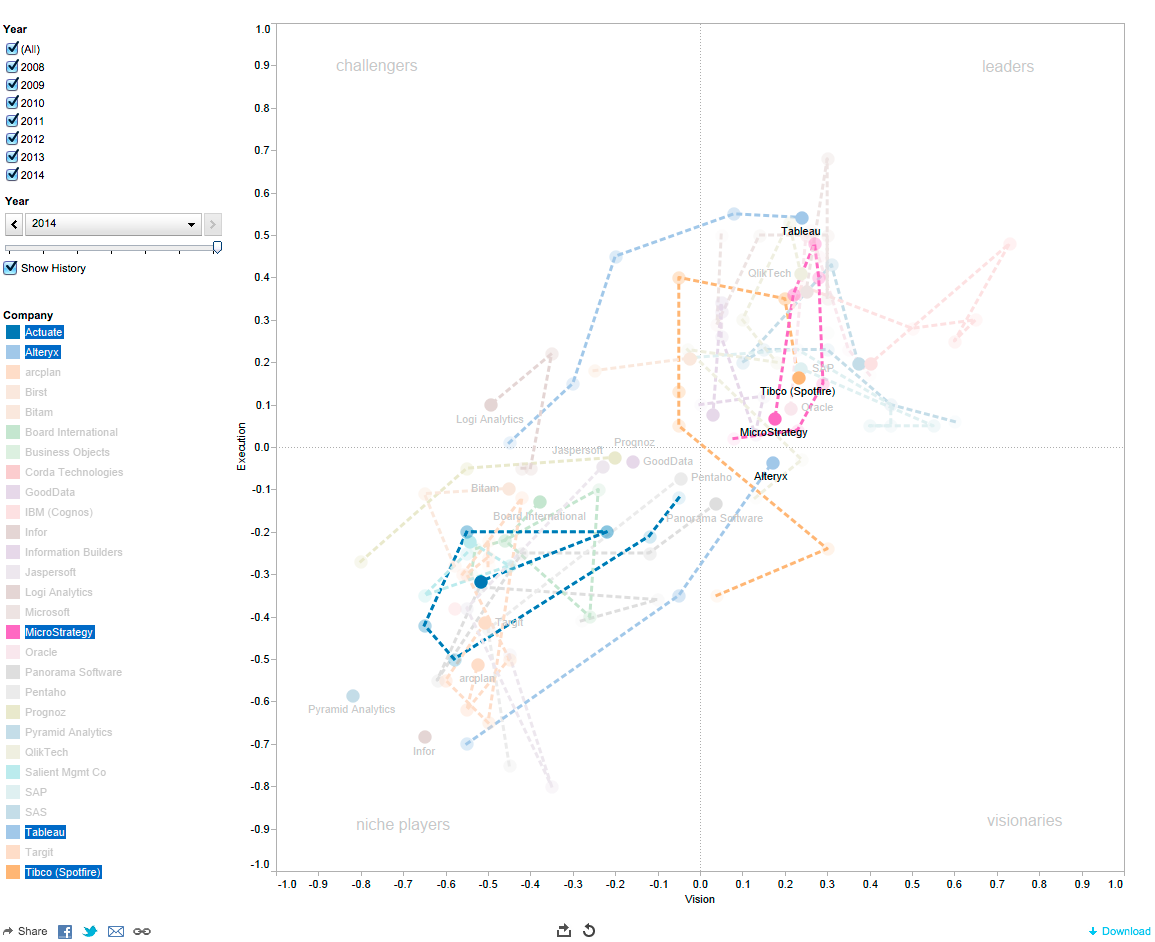
Public Tableau workbook with 7 years of BI Magic Quadrant data.

One response to “Magic Quadrant Business Intelligence 2014”